 Sell tickets and manage registrations
 View my tickets and registrations
 Sell more tickets through digital marketing
 Add an event calendar to your website
 Find events by location and categories
Develop Web Maps and Geographic Visualizations with JavaScript - Spring 2020

Learning Objectives
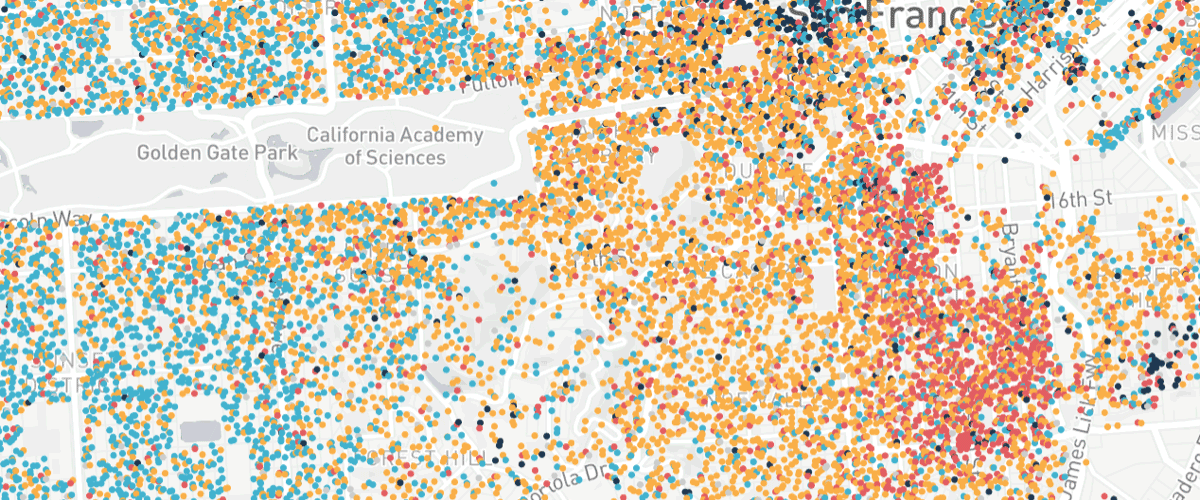
Have you ever seen a beautiful interactive map visualization online and wondered how the heck they did that? Sometimes the world of interactive maps and data visualization can be overwhelming: which tools should I use? What language should I learn? Is my data going to work? This workshop aims to give you the foundation to start developing your own interactive maps and geospatial visualizations for the web by focusing on a few popular and open source tools that you can master and build on as you go. With a few foundational skills and a bit of knowledge, friendly and energetic Dan Swick will show how you can build your own beautiful maps and visualizations for the web. We’ll cover:
- processing and working with spatial data on the web
- working with several popular JavaScript libraries to build visualizations
- publishing your creation for others to see
This workshop assumes some working knowledge of HTML, CSS, and JavaScript. If you’re new to those languages but are still interested, we can send you some materials to get started ahead of time.
Your Instructor
Dan is friendly, patient, and fun - one of our most popular instructors. He is a Frontend Platform Engineer at Mapbox who "jumps down technical rabbit holes a bit too quickly". He works on shared tools to help Mapbox's frontend teams launch great web pages and applications.
This Workshop Meets Four Times
-
Wednesday, March 25 (6:00 - 9:00 p.m.)
-
Wednesday, April 1 (6:00 - 9:00 p.m.)
-
Wednesday, April 8 (6:00 - 9:00 p.m.)
-
Wednesday, April 15 (6:00 - 9:00 p.m.)
Your Registration Includes:
-
Hands-on lab time and opportunity to work closely with the instructor
-
Certificate of Attendance and/or Completion, upon request
-
Students must bring their own laptops to participate in this workshop, either a PC or a Mac.
Questions?
Contact Rick Kos, BayGeo's Education Director at rkos@baygeo.org
For more information about this workshop, the GIS Educaton Center, and our refund policy, please visit ccsfgis.org